
As the global average tenancy ratio of towerco-owned towers passes two, TowerXchange updates our analysis of the structure of the international tower industry, including the impact of a further 250,000 towers being carved out into operator-led towercos. We also look to the future at the evolution of towercos into holistic digital infrastructure service providers. How have these trends affected the shape of the global telecom tower industry?
TowerXchange track 304 towercos that now own 3.37mn of the world’s 4.82mn investible towers and rooftops, representing 69.9% penetration into our industry’s addressable market (source: TowerXchange, Q319).
Figure one: The structure of the telecom tower industry

The telecom tower industry has a ‘top heavy’ structure. Figure one illustrates the breakdown in the ownership of those 3.37mn towerco towers and rooftops. We had to distort the scale of this infographic to accommodate the massive China Tower Corporation, which represents nearly two thirds of the tower industry’s total towers, while a total of 17 towercos with 20,000 or more towers still represent over 83% of our towers. There is still significant scale to be found among the 29 towercos with 5,000 to 19,999 towers, who together own 297,443 towers and rooftops. The tower industry has a ‘long tail’ of 258 mostly privately owned towercos with less than 5,000 sites, which account for 197,786 sites – including 60,230 sites attributed to towercos TowerXchange know exist, but whose names we do not know – the majority of which are from China and Vietnam.
1.45mn towers are still trapped on MNO balance sheets. The full value of a tower or rooftop cell site cannot be unlocked while it remains on an MNO balance sheet, where it is typically recognised only as a cost centre: a depreciating asset, built to serve the needs of a single tenant only, and seldom (often reluctantly) shared with third parties. The average tenancy ratio of an MNO captive tower is less than 1.1 worldwide.
Take that same tower, and transfer it to a tower company, and it is transformed into a profit centre: a source of long-term recurring revenue from multiple credit worthy tenants. The average tenancy ratio of towerco owned and operated towers worldwide is almost exactly 2.0. The capital markets recognise the fundamental differences in the value of tower assets when managed by independent towercos, creating a relative valuation arbitrage between MNOs, with enterprise valuations typically of 4-9x EBITDA, and towercos, typically valued at 9-30x, which drives the continuing transfer of assets from MNOs to towercos.
Figure two: Towerco penetration by business model and by region

That same relative valuation arbitrage has prompted a new phenomenon over the last five plus years: the rise of the operator-led towerco. Operator-led towercos are defined as towercos that are at least 50.01% owned by their parent MNO or MNOs. Figure two shows the operator-led towerco segment in orange. In the last year alone, there have been announcements that over 250,000 towers are being carved out into operator-led towercos, including new towercos owned by Reliance Jio, Vodafone, Orange and Hutchison, all of which are new entrants into figure one. To express that same growth another way: the operator-led towerco sector has expanded by the equivalent of more than eight edotcos in the last year! Operator-led towercos now own 55.6% of the world’s towers, up from 52.7% at the same time last year. The independent towerco sector may appear dwarfed by the operator-led segment, but their market share is still distorted by China Tower. If one removes China Tower from the equation, operator-led towercos would own 24.6% of the world’s towers, and independent towercos 22.2%. Restoring China Tower, the current global market share of independent towercos – towercos that are owned by public and private shareholders, not by MNOs, and shown in red on figure two – is 13.1%, up from 12.8% a year ago. It should also be noted that many independent towercos have superior profit margins and enterprise values to their operator-led cousins – indeed, independent towercos represent more than half the tower industry’s estimated aggregate enterprise value.
There is a small segment of joint venture infracos shown in green on figure two, exemplified by Cornerstone and MBNL in the UK and by several Scandinavian joint ventures. These are a unique category because they are created to share towers only between joint venture partners, they don’t proactively lease-up to third parties. TowerXchange anticipate a number of joint venture infracos being restructured as independent or operator-led towercos in the coming years.
The growth of the operator-led towercos and independent towercos has come largely at the expense of MNO-captive sites, shown in blue on figure two. The proportion of towers owned by MNOs fell from 33.1% this time last year to 30.2% today. Many of these tower assets are trapped on MNO balance sheets as a function of regulatory policy, for example if foreign direct ownership of towers is not permitted to exceed 50%. In other instances, the MNO may still see its towers as a source of competitive differentiation, or the market it serves or MNO itself may be seen as less investible by the tower industry.
Between towercos approaching saturation of addressable markets and investible portfolios worldwide, combined with the increasing tendency of MNOs to carve out and keep operator-led towercos, towercos are having to look beyond their core business of building, buying and leasing ‘vertical real estate’ to consider new assets and new services. Indeed, speaking to many towerco leaders, upwards of 50% of organic growth is now found not in macro towers and rooftops, but in lamp posts and in-building solutions.
Figure three: Towerco 2.0: From steel and concrete to signal and service
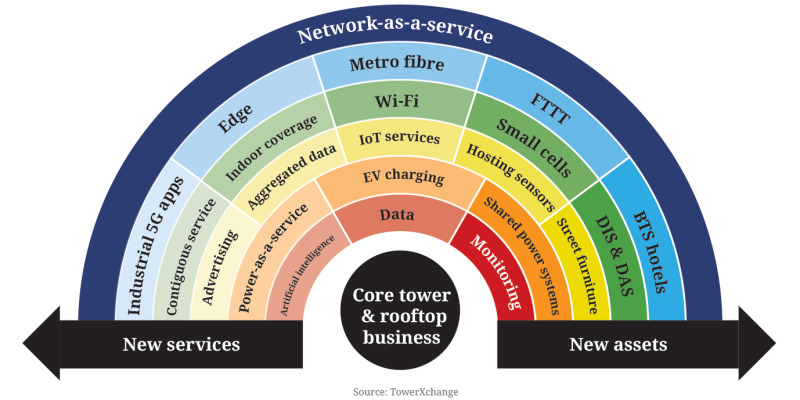
Figure three visualises many of the new assets and new services being explored as towercos evolve from a focus on steel and concrete, to a focus on service and signal. At every regional TowerXchange Meetup this year, debate and discussion among the tower industry’s leaders has focused on the tower industry’s journey from the centre of this graphic – our core business of towers and rooftops, pushing further to the edge of this graphic, and further from our comfort zone. These concepts are not ideas on a whiteboard for many towercos, they are moving beyond proof of concept to large-scale rollout of the alternate site typologies and business model innovations shown in figure three. Examples include:
- Crown Castle spending US$37bn to acquire and deploy 75,000 route miles of fibre and 70,000 small cells
- Digital Colony seeking to add fibre leader Zayo Group to a portfolio that already includes towers, small cells and both co-location and edge data centres
- edotco deploying more lamp post sites than macro sites in Malaysia in the last year
- China Tower making a business out of gas pipeline monitoring
- Cellnex’s Adaptive Edge proposition
- Russian Towers providing contiguous outdoor to indoor network as a service
In his keynote fireside chat with me at the TowerXchange Meetup Asia 2019, Bimal Dayal, CEO of Indus Towers, suggested that within three to five years, he foresaw the equivalent value of a full tenancy being derived from new services and new assets. That could represent upwards of a third of revenues. Similarly, China Tower anticipates 33% of its revenue growth being derived from non-traditional MNO tenancy revenue.
The challenge for many towercos is less which digital infrastructure assets to invest in, more to evolve our competencies and capabilities to enable these new services. How many towercos know how to operate a smart city? How to aggregate and analyse sensor data to transform it into actionable intelligence we can sell? How to deliver and monetise EV charging infrastructure? Or how to sell advertising on a smart pole?
However, as an industry we must navigate these diversification opportunities with sensitivity to the risk of dilution of margins and valuations that comes from the uncertainty of these new opportunities, compared to the relative certainty of our core tower and rooftop leasing businesses.
Conclusions
The shape of the tower industry today is dramatically different to the industry TowerXchange started serving eight years ago. The core towerco proposition and business model has been successfully adapted to suit the needs of new markets in Africa, Southeast Asia, China, Europe and, most recently, the Middle East. There is relatively little territory left for our industry to colonise. But as the geographical opportunities narrow, diversification opportunities broaden, driven to a significant extent by the new communications infrastructure topographies required by 5G. Many towercos will hunker down in their core business of building, buying and leasing vertical real estate – and such towercos will still see plenty of 5G antenna overlaid onto their towers. But the early adopters of a broader range of digital infrastructure assets and services have been joined by fast followers, and the late majority are waking up to these opportunities. If we are to sustain our industry’s growth narrative, and extend the efficiencies we generate by sharing infrastructure, then that journey from steel and concrete to signal and service is a journey the majority of us will be taking in the coming three to five years.